
Operator Margin and House Edge in Virtual Basketball
 Available in US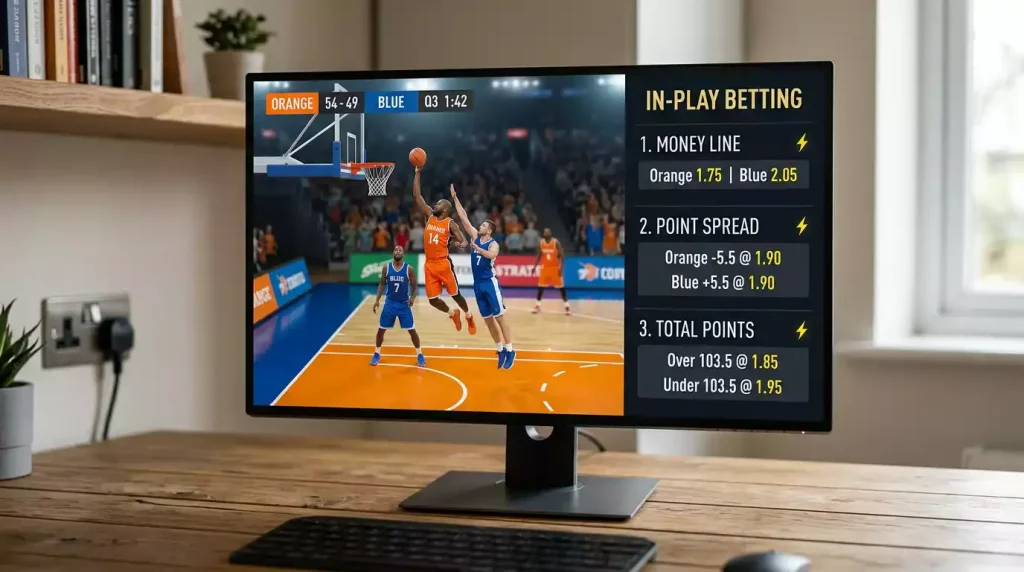
Evaluating Operator Margins Prior to Placing Stakes
A friend once told me he had been playing virtual basketball for six months without ever working out the bookmaker’s margin on the markets he was betting. He was puzzled why his bankroll kept eroding even when his “win rate felt about right”. Five minutes with the odds and a calculator told him everything he needed to know: he had been giving up roughly 7-8% of every stake to the overround, week in and week out, and no amount of decent picking could outrun that drag.
This is the conversation every virtual sports bettor should have before the first wager, not after the first downswing. The house edge is not a hidden trick. It is openly priced into every line on the screen – you just have to know how to read it.
Defining House Edge on a Virtual Product
House edge on virtual basketball is the operator’s mathematical margin baked into the odds. Unlike live sports – where the operator estimates probabilities and adds a margin on top – virtuals run on an RNG with a known probability distribution. The engine outputs match results according to fixed mathematics, the provider knows exactly what those probabilities are, and the operator’s job is to publish odds that deliver a target margin over thousands of cycles.
The crucial point: there is no genuine uncertainty for the operator. On an NBA game, the bookmaker is guessing the true probability and earns margin only on average over many bets, with single-game variance running in both directions. On a virtual basketball cycle, the operator already knows the long-run frequency of each outcome – the maths is published in the RNG documentation, certified by an independent testing laboratory, and stable across millions of cycles. The 77.6% share that RNG-based products hold in the global virtual sports market sits on top of this fundamental architecture.
That fixed-edge structure is why virtuals are categorised differently from real sports for both regulatory and commercial purposes. Operators do not need a trader watching the market – they need a settings file with the right overround.
Calculating the Overround From Offered Odds
Overround is the simplest tool for measuring house edge directly from the odds you can see. It works like this. Take the implied probability of every outcome in a market – for decimal odds, that is 1 divided by the price – add them together, and subtract 100%. The remainder is the overround. Anything above zero is the operator’s margin.
A worked example using a generic virtual basketball money line. Assume a two-way market with no draw possible, where Team A is priced at 1.85 and Team B is priced at 1.85. Implied probability of Team A is 1/1.85 = 54.05%. Same for Team B = 54.05%. Total implied probability = 108.10%. The overround is 8.10%. That is the long-run margin the operator earns on this market, expressed as a percentage of total stakes wagered on both sides.
Now try a money line where Team A is 1.50 and Team B is 2.40. Implied A = 66.67%, implied B = 41.67%, total = 108.34%, overround = 8.34%. Almost identical margin, dressed in different odds. The shape of the line tells you which team the engine considers the favourite; the overround tells you what the operator is taking from each cycle. The two readings answer different questions.
Try this on three or four virtual basketball markets on whichever UK operator you use most. You will find that money line overrounds typically sit somewhere in the high single digits – often 6% to 9% – and that the exotic markets like winning margin or specific quarter total bands can run several percentage points higher. Knowing the number before you bet is the first piece of homework that actually pays off.
Virtual Margins vs Live Sport Margins
This is where the comparison gets interesting. The same operator on the same platform usually runs noticeably tighter margins on real NBA games than on virtual basketball. NBA money line overrounds on UK sportsbooks frequently sit around 3% to 5% for the most-followed matchups; virtual basketball money lines on the same platform are commonly in the 6% to 9% range.
The reason is the sharp-money dynamic I sometimes describe to newer punters as the “trading desk effect”. A live NBA market is pressed by professional bettors who exploit any pricing inefficiency. Operators that run wide margins on NBA lose market share to competitors who run tighter ones. The competitive equilibrium drags the live margin down. Virtual basketball has no sharp-money pressure because there is nothing to analyse – every cycle is mathematically independent, so the operator can run a wider margin without losing volume to a competitor running a tighter one. The competitive constraint is weaker, and the margin is higher.
The implications for your bankroll are real. A 1,500-pound bankroll wagered through 7% overround over a hundred cycles burns roughly 105 pounds to the house edge before any variance. Through 4% overround over the same volume, it burns 60 pounds. The difference is not flashy in a single session – it shows up across months.
RTP on RNG-Driven Sports
RTP, return-to-player, is the casino-style framing of the same idea seen from the player’s side. If a virtual basketball market has an overround of 7%, the RTP on that market is approximately 93%. Over enough cycles, that is the fraction of total wagered amount that returns to players as winnings; the other 7% goes to the operator.
RTP figures for virtual sports are not generally disclosed in the same prominent way RTP is disclosed for slots. Online slots are required to display their RTP under UK Gambling Commission rules, and the average across regulated UK slots typically lands in the 94% to 96% range. Virtual sports sit broadly in the same neighbourhood – sometimes slightly lower depending on the market – but the disclosure is buried in technical documents rather than displayed on the betting page.
One useful frame for context. Sportradar’s CEO Carsten Koerl has been explicit about the scale of the sector, noting that “more than 70 % of our revenues are outside of the US. And soccer is the main betting sport.” The virtual sports B2B economics are built on a high-volume, fixed-margin model: the provider earns a slice of operator GGY, and the operator earns the overround margin on player turnover. Both parties operate on confident long-run mathematics, and the player operates on confident long-run loss expectation.
Practical Implications for Long Sessions
The session arithmetic is where the abstract margin number becomes painfully concrete. Picture a punter placing a 5-pound stake on a money line every cycle, with cycles arriving every four minutes. That is fifteen stakes per hour, 75 pounds in turnover. At a 7% market overround, the expected loss per hour is 5.25 pounds before any variance from individual outcomes.
Run that for a three-hour evening session and the expected loss is roughly 15.75 pounds. Run it for five sessions a week and the expected loss is around 78 pounds – every week, before any variance, just from the structural edge. The numbers compound quickly because the cycle frequency is so high. Virtual sports events typically run two to five minutes, 24 hours a day, which means a player can put far more turnover through a virtual basketball book in a week than through a comparable NBA book in a month.
This is the maths I want every new virtual sports player to internalise before they fall in love with the format. You can enjoy virtual basketball as entertainment with a clear-eyed view of the cost. What you cannot do is treat it as a serious wagering pursuit where positive expectation is achievable. The edge is fixed, structural and openly priced – and your job as a player is to size your stakes so the expected cost fits comfortably within your entertainment budget. For more on how that stake sizing actually works on a 4-minute cycle, my piece on virtual basketball stake sizing gives a deeper look at how to calibrate unit size to the structural overround.
Is the RTP of virtual basketball disclosed by UK operators?
Not in the prominent way RTP is shown on slots. UK Gambling Commission rules require slots to display RTP openly, but virtual sports RTP figures typically live in technical documents – the operator"s virtual sports rules page or the provider"s certification documentation – rather than next to the market price. A player who wants the number can usually find it but rarely sees it on the betting screen. The implied figure from observable overrounds tends to land in the low- to mid-90s percent range.
Does the house edge change between markets like money line and quarter handicap?
Yes, often substantially. Money line and main spread markets carry the lowest overrounds – typically in the high single digits on virtual basketball. Quarter handicaps, alternative totals and especially winning margin markets can carry meaningfully higher overrounds, sometimes into double digits. The shift reflects both player demand for exotic markets and the operator"s pricing flexibility on bets that draw smaller volumes. The check is simple: calculate the overround on each market you intend to use.
Articles
Prepared by the Virtual Basketball Bet editorial staff.
